IRIS — Organizational Intelligence Maturity Model
In the era of agentive AI
Introduction · The Thesis
With the general map drawn in the Introduction — the inversion of the flow (“intelligence goes to the people”), the three axes of change, and the Quantum Leap — this chapter descends to the first axis of the path: how organizational intelligence is measured, stage by stage. IRIS models that complete trajectory, from fragmented information to the self-managing ecosystem.
Why “organizational intelligence” and not “information management”?
The term that names the axis was established in the Introduction: organizational intelligence is what gets measured when the scope covers all four layers of the Value Pyramid — not just managing data, but generating knowledge and acting on it continuously and autonomously. IRIS operationalizes that capacity, stage by stage.
Online Enterprise vs. Real-Time Enterprise
Recalling the distinction the Introduction established — the online enterprise accesses; the real-time enterprise acts — the model operationalizes it like this:
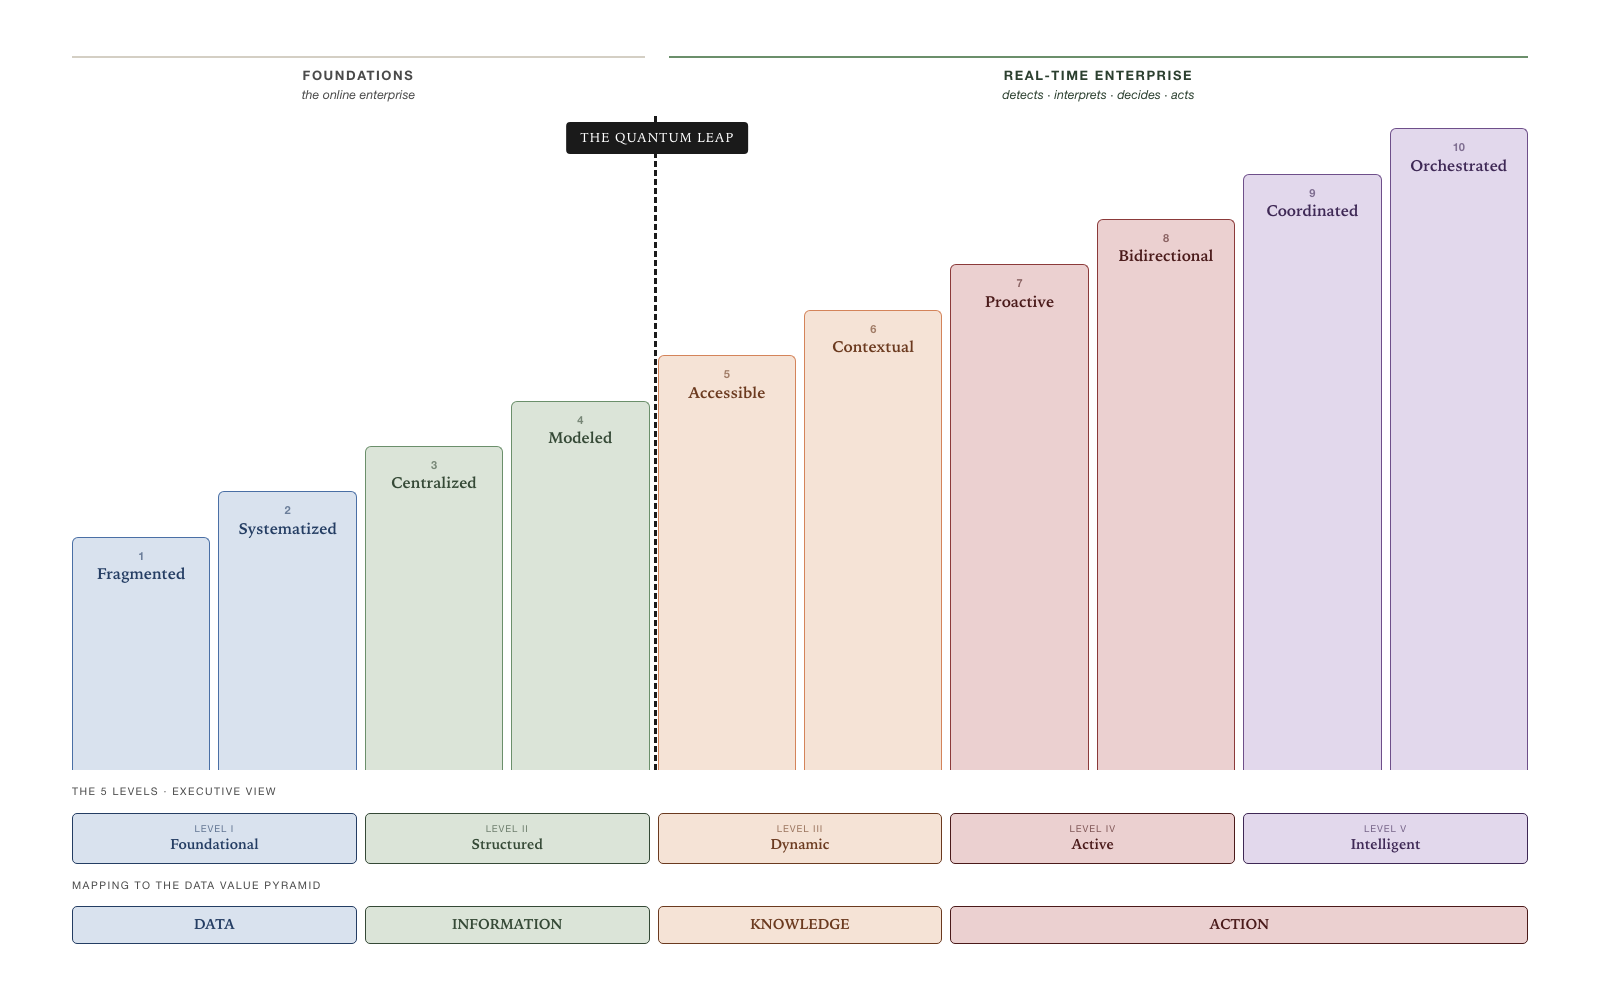
Stages 1–4 of the model build the foundations: from fragmented data to a governed semantic model. Stage 4 (Modeled) completes the data infrastructure — integration, shared definitions, formal governance — but analytical exploitation still depends on technical intermediaries.
Stages 5–10 build the real-time enterprise: from democratic access without intermediaries, through contextual and proactive information, systems that anticipate and act, up to a self-managing intelligence ecosystem. Stage 5 (Accessible) is where the paradigm changes — anyone gets answers without intermediaries — and Stage 10 (Orchestrated) represents the real-time enterprise in full.
The convergence
The convergence of the four concepts — organizational intelligence, organizational automation, the real-time enterprise, and agentive AI — was traced in the Introduction; IRIS measures the first.
The industry context data and the public sources that support this vision are in the Introduction of this book.
IRIS and MOTOR: AURA’s diagnostic pair
IRIS is one of two complementary models within AURA. Together with MOTOR (the Organizational Automation Maturity Model), they form the complete diagnostic of organizational transformation:
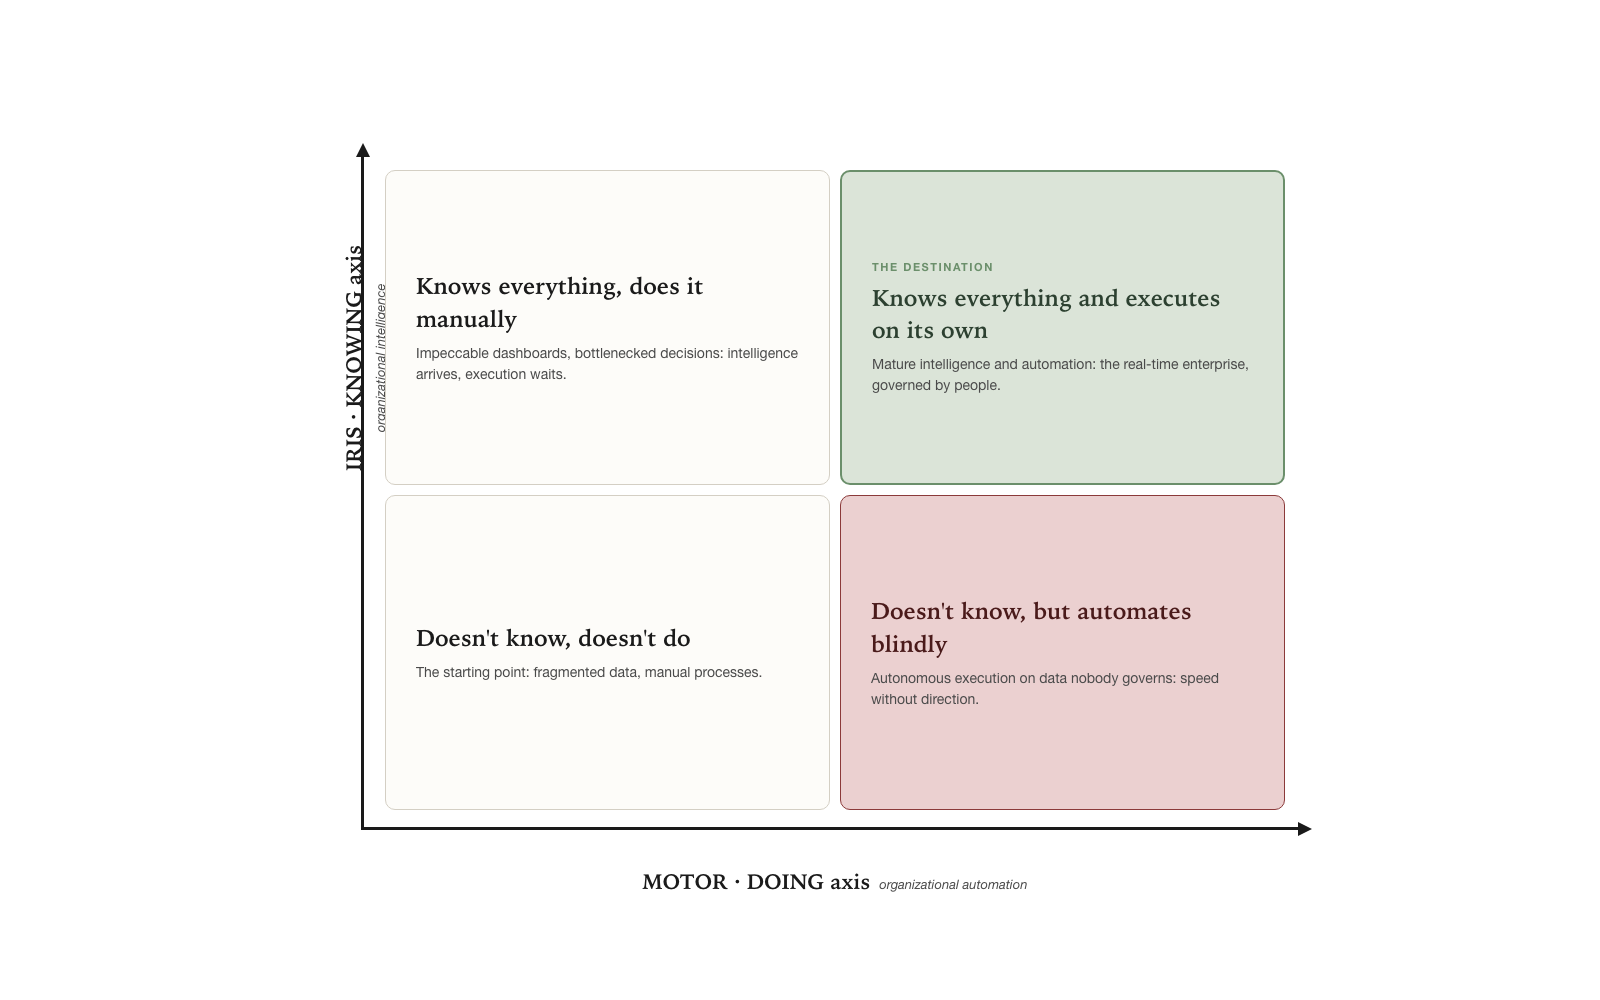
IRIS measures how well information flows — from fragmented data to a self-managing intelligence ecosystem. MOTOR measures how automated the processes are — from ad-hoc use of AI to orchestrated autonomous execution.
The orthogonality of the pair was established in the Introduction: an organization can know much and do little, and vice versa. Here it is enough to recall that full maturity demands progress along both axes.
Diagnostic nature
IRIS is a diagnostic model. Its purpose is to assess which stage an organization is in and what that stage means — not to prescribe what to implement, how much to invest, or on what timeline. Prescription is the work of the consulting practice that rests on that diagnosis.
This design decision is intentional: the state of the art in AI evolves at unprecedented speed. A model that prescribes specific technologies becomes obsolete in months. A model that diagnoses maturity states remains valid because it measures organizational capabilities, not tools.
Structure of the Model
The model assesses organizational intelligence maturity through 10 stages that represent progressive states in the organization’s capacity to transform data into action.
Stages 1–4 build the foundations (online enterprise); stages 5–10 build the real-time enterprise. The 10 stages are grouped into 5 levels that offer a simplified view for executive communication.
Design principles
Focus on organizational intelligence, not AI adoption. Each stage is defined by the organization’s capacity to transform data into action — how information is captured, structured, accessed, contextualized, distributed, and acted upon. Agentive AI appears as the enabling mechanism, not as the object of measurement.
Evolutionary coexistence. Each stage subsumes the previous one rather than replacing it. An organization at Stage 8 does not eliminate its data warehouse — it integrates it into a system where information flows proactively. The infrastructure of earlier stages becomes foundation, not legacy.
Gradual progression. The transitions between stages represent leaps of reasonably equivalent magnitude. This allows the organization to plan realistic advances and measure progress proportionally.
Stage 1 · Fragmented
Information exists scattered with no connection between systems
Information flow: Data exists scattered across multiple systems with no connection between them.
The organization operates with islands of information. Each department, system, or process generates data that lives in its own silo — ERPs, spreadsheets, shared files, legacy systems, departmental databases. There is no inventory of what data exists, where it resides, or who is responsible for it.
When someone needs information to make a decision, the process is manual and ad-hoc: searching through emails, asking colleagues for files, consolidating data in Excel, correcting inconsistencies by hand. The same piece of data can exist in three different versions without anyone knowing which one is correct. Reports are built from scratch every time they are needed.
Value concentrates in the DATA layer of the Value Pyramid.
Observable characteristics:
- No central data repository or catalog of sources exists
- Reports are built manually from multiple disconnected sources
- Frequent inconsistencies between data from different areas (numbers that don’t add up between finance and operations)
- The “source of truth” depends on whom you ask
- No defined roles for data management
- Decisions based on intuition, experience, or anecdotal data
Diagnostic question: If I ask two people from different areas for the same indicator, will I get the same number?
Stage 2 · Systematized
Data is captured in an orderly fashion in defined systems
Information flow: Data is captured in an orderly fashion in defined systems, although analytics remains manual.
The organization has taken the first structural step: there is awareness that data is an asset, and systems have been implemented to capture it consistently. There is an ERP or transactional system that serves as the backbone, registration processes are standardized, and basic data-integrity rules exist.
The difference from the previous stage is not technological but organizational: someone has asked “how should we capture this?” instead of simply letting the data pile up. However, the exploitation of that data remains manual — ad-hoc extractions, reports in Excel, periodic consolidations.
Leap 1→2: The organization moves from accumulating data as a byproduct to capturing it with intention and discipline.
Observable characteristics:
- Standardized transactional systems (ERP, CRM) with defined registration processes
- Basic data-integrity rules (required fields, validations)
- Data-extraction processes identified, though manual or semi-automatic
- Data owners assigned at least informally
- Periodic reports generated manually but with identified sources
- Data is reliable within each system, although crossing systems remains difficult
Diagnostic question: Is there a defined system for capturing the key business transactions, with consistent registration rules?
Stage 3 · Centralized
Data is consolidated in a central repository with formal BI
Information flow: Data is consolidated in a central repository and standardized reports are generated.
The organization has implemented a data warehouse or central repository that consolidates data from multiple sources. ETL (Extract-Transform-Load) processes feed this repository on a regular basis. Standardized dashboards and reports have been built that offer a unified view of the business.
This is the classic Business Intelligence model: a technical team builds and maintains the analytical infrastructure, and business users consume the predefined reports and dashboards. The flow is unidirectional — data goes in, reports come out — and analytical capacity is limited to what has been pre-built.
Value concentrates in the INFORMATION layer of the Value Pyramid — data with context, structure, and purpose.
Leap 2→3 · Level frontier (Foundational → Structured): The organization moves from having data to using data to understand the business. It requires investment in analytical infrastructure and in the organizational discipline to maintain it.
Observable characteristics:
- Data warehouse or central repository implemented
- Automated ETL processes that consolidate data periodically
- Standardized dashboards and reports in a BI tool (Power BI, Tableau, etc.)
- Dedicated BI/data team that builds and maintains the infrastructure
- KPIs defined and visible to the organization
- Users access pre-built information — if it isn’t on a dashboard, it doesn’t exist
Diagnostic question: Is there a centralized data warehouse with dashboards that business users consult regularly?
Stage 4 · Modeled
Data is organized with semantic business definitions
Information flow: Data is organized into semantic models with shared business definitions.
The organization has gone beyond merely centralizing data: it has modeled it. A dimensional or semantic model exists that translates technical data into business concepts — “revenue” is not a field in a table but a concept defined with clear rules of calculation, granularity, and context. Metrics have unique definitions shared across the entire organization.
The key difference from the previous stage is the presence of a semantic layer — formal or informal — that separates “what the data means” from “where the data lives.” This enables more sophisticated analysis: dimensional analysis, drill-downs, comparative analysis, and a certain self-service capacity for advanced users.
Observable characteristics:
- Documented dimensional or semantic data model
- Shared, governed definitions of metrics and KPIs (metrics catalog)
- Drill-down and dimensional analysis capability
- A certain level of self-service for advanced business users
- Formalized data governance with metric ownership
- Data-quality processes identified and monitored
- Business users can ask questions within the modeled universe, though not outside it
Diagnostic question: Do the key business metrics have a single, governed definition that the whole organization shares?
Stage 5 · Accessible
Anyone accesses information without technical intermediaries
Information flow: Anyone can get answers from the data without depending on technical intermediaries.
The organization has democratized access to information. No analyst or BI team is needed to answer a business question — users can query directly, whether through conversational interfaces, augmented-analytics tools, or semantic search over the data.
What used to take a week (coordinating with the BI team, gathering requirements, waiting for development, validating results) now takes minutes. The bottleneck of human intermediation disappears. This does not mean the data team disappears — it transforms: from builder of reports to curator of the semantic layer and guardian of the quality of the data the systems consume.
Stage 5 is the first state of the real-time enterprise: all the information is available, access is democratic, the organization can answer any question in minutes. The paradigm has changed — the foundational infrastructure is resolved and the organization operates in a qualitatively different model — although autonomous reaction has not yet begun.
Value concentrates in the KNOWLEDGE layer of the Value Pyramid — understanding, patterns, real-time analysis.
Leap 4→5 · Level frontier (Structured → Dynamic) — the Quantum Leap: This is the leap that changes the paradigm. It represents the transition from a paradigm where information only exists if someone pre-built it, to a paradigm where it is generated in real time out of need. It is the point where the cost of an analytical question collapses from weeks to seconds. This is the frontier between the foundations (online enterprise) and the real-time enterprise — where agentive AI enables a qualitative change in the relationship between the organization and its information.
Observable characteristics:
- Conversational or natural-language data-access interfaces
- Business users get answers without writing SQL or waiting for an analyst
- The semantic layer allows intelligent systems to interpret questions with precision
- The data team focuses on curating data and models, not on building reports
- The volume of analytical questions increases significantly (questions nobody used to ask are now asked)
- Coexistence with dashboards for continuous KPI monitoring
Diagnostic question: Can a manager get an analytical answer that was not pre-built into a dashboard, in minutes instead of weeks?
Stage 6 · Contextual
Information adapts to context and enriches answers
Information flow: Information adapts to context and flows differently depending on who needs it, when, and what for.
Stage 6 deepens the real-time enterprise: it is no longer just about information being available, but about the system understanding what the information means in each context.
Beyond merely answering questions, information becomes contextual and adaptive. The same piece of data is presented differently depending on the role, the moment in the business cycle, or the decision being made. Analyses are not static — they evolve, incorporate new sources, and adjust to changing needs.
The difference from the previous stage is that information is no longer just “available” — it is alive. Sources are crossed, patterns are detected, analyses are generated that nobody explicitly asked for but that are relevant. The system does not just answer questions; it enriches them with context.
Leap 5→6: The organization moves from answering questions to delivering contextual, living information. The system begins to understand, not just to show.
Observable characteristics:
- Analysis contextualized by role, moment, and need
- Automatic crossing of data sources to enrich answers
- Capacity to iterate and drill deeper through chains of complex questions
- Pattern and anomaly detection as part of the analytical flow
- Information is presented differently to a CFO than to an operations manager, even when the question is similar
- Ad-hoc analyses as reliable as pre-built reports
Diagnostic question: Is the system capable of crossing sources and enriching an answer with relevant context the user did not explicitly ask for?
Stage 7 · Proactive
Information anticipates needs and seeks out the user
Information flow: Information anticipates needs, alerts about relevant situations, and reaches the right people without being asked for.
The organization does not wait for someone to ask. Systems monitor continuously, detect situations that require attention, and deliver the relevant information to the right person before they request it. An agent detects that an indicator crossed a threshold, analyzes the probable cause, and notifies the responsible party with the context needed to decide.
The fundamental change is the direction of the flow: from pull (the user seeks information) to push (information seeks out the user). Humans are still the ones who decide and act, but information reaches them proactively and contextualized.
Value concentrates in the ACTION layer of the Value Pyramid — information stops informing decisions and starts triggering them.
Leap 6→7 · Level frontier (Dynamic → Active): The frontier between organizations that use information to understand and organizations where information acts. Information does not wait to be consulted — it seeks out whoever needs it and triggers action. The capacity for autonomous reaction begins here.
Observable characteristics:
- Continuous monitoring of key indicators with anomaly detection
- Intelligent, contextualized alerts (not just “X dropped” but “X dropped because of Y, and that affects Z”)
- Information reaches the right responsible party proactively
- Automated root-cause analysis accompanying the alerts
- Reduction of the time between an event occurring and the corrective action
- Dashboards are complemented by personalized push information flows
Diagnostic question: Do business owners receive relevant information before asking for it, with enough context to act?
Stage 8 · Bidirectional
Information triggers governed autonomous actions
Information flow: Information does not only reach people — it also flows between systems and triggers autonomous actions within defined limits.
The flow of information becomes bidirectional and operational. Agents do not just alert — they execute predefined actions when the conditions are met. An agent can adjust an operating parameter, reclassify a case, or trigger a process, all within explicitly governed rules. The human defines the thresholds, the rules, and the escalation protocols; the agent operates within those limits.
The difference from the previous stage is that the Perceive→Interpret→Decide→Act→Learn cycle is completed without human intervention in the cases that fall within the governed parameters. The human supervises patterns, exceptions, and results — not every transaction.
Leap 7→8: The organization moves from information that alerts to information that acts.
Observable characteristics:
- Agents that execute operational actions within defined parameters
- Automated workflows that integrate analysis and action
- Clear escalation protocols: what the agent can decide vs. what requires a human
- Complete traceability of every autonomous decision (who, what, why, when)
- Autonomy governance: defined roles for managing the agents’ limits
- Humans focus on exceptions, rule refinement, and supervision of results
Diagnostic question: Are there agents that execute operational actions autonomously with traceability, within rules that humans define and supervise?
Stage 9 · Coordinated
Agents and flows coordinate across business domains
Information flow: Multiple agents and information flows coordinate across domains to optimize cross-cutting results.
Agents that operated independently in different domains (sales, operations, finance, supply chain) begin to coordinate. A sales agent that detects a change in demand communicates the information to the supply-chain agent, which adjusts inventory levels, which in turn informs the financial agent, which updates the cashflow projections. Information flows in an orchestrated way across domains.
The key to this stage is not AI sophistication — it is the integration of information across domains with the semantic consistency and the governance needed for agents from different areas to communicate and act coherently.
Value concentrates in the ACTION layer of the Value Pyramid — governed autonomous execution at organizational scale.
Leap 8→9 · Level frontier (Active → Intelligent): This is where organizational intelligence reaches systemic scale: agents that operated in independent domains coordinate with each other. Information flows across the entire organization, enabling cross-cutting optimization. The real-time enterprise stops being a departmental capability and becomes an organizational one.
Observable characteristics:
- Agents from different domains that share information and coordinate actions
- Cross-domain semantic consistency: business concepts are defined in a unified way
- Optimization of results that cross departmental boundaries
- Organizational knowledge graph connecting entities, relationships, and business rules
- Governance of interactions between agents (not just of individual agents)
- Humans manage the system as a whole, not as isolated domains
Diagnostic question: Do agents from different areas of the business communicate with each other to coordinate actions with consistent information?
Stage 10 · Orchestrated
The information ecosystem manages itself with strategic supervision
Information flow: The information ecosystem manages itself: it optimizes, corrects, evolves, and governs itself continuously with strategic human supervision.
The final stage represents an information ecosystem that operates like an intelligent organism. Not only do the operational agents coordinate with each other — the system itself optimizes its own capabilities: it identifies gaps in data coverage, suggests new semantic models, detects inefficiencies in information flows, and evolves its own architecture within governed frameworks.
Human supervision rises to the strategic plane: defining the direction, the values, and the limits of the ecosystem. Tactical and operational decisions flow autonomously. The organization does not “manage information” — it is an intelligent organism where knowledge flows, is generated, and is acted upon continuously. It is the real-time enterprise in its fullest expression: organizational intelligence operating at maximum capacity.
Leap 9→10: The system moves from coordinating to managing itself — evolving autonomously within strategic frameworks.
Observable characteristics:
- The ecosystem self-diagnoses: it detects gaps in data, quality, and coverage
- Autonomous evolution of semantic models and information flows
- Continuous learning: the system improves its performance with every cycle
- Human supervision focused on principles, strategic direction, and exceptions
- Multi-level governance: operational (automated), tactical (supervised), strategic (human)
- Ecosystem health metrics monitored and optimized autonomously
- Capacity to adapt to changes of context (regulatory, market, organizational) proactively
Diagnostic question: Does the information ecosystem evolve autonomously — identifying gaps, improving models, and optimizing flows — with human supervision only at the strategic level?
Analysis of the Leaps Between Stages
A design principle of the model is that the 9 leaps between stages represent transitions of reasonably equivalent magnitude. The leaps marked with ★ cross level frontiers.
| Leap | From → To | Nature of the change | Magnitude |
|---|---|---|---|
| 1→2 | Fragmented → Systematized | Moving from scattered data to orderly capture | Medium |
| ★ 2→3 | Systematized → Centralized | Consolidating into a central repository + BI tools | Medium |
| 3→4 | Centralized → Modeled | Adding a semantic layer and business definitions | Medium |
| ★ 4→5 | Modeled → Accessible | Democratizing access (the Quantum Leap) | Medium-High |
| 5→6 | Accessible → Contextual | From answering questions to living contextual information | Medium |
| ★ 6→7 | Contextual → Proactive | Inverting the flow: from pull to push | Medium |
| 7→8 | Proactive → Bidirectional | Enabling governed autonomous action | Medium-High |
| ★ 8→9 | Bidirectional → Coordinated | Coordinating agents cross-domain | Medium |
| 9→10 | Coordinated → Orchestrated | Self-management of the ecosystem | Medium-High |
The three leaps marked Medium-High (4→5, 7→8, 9→10) correspond to the most transformative transitions: the democratization of access, the enablement of autonomous action, and the self-management of the ecosystem. This slight asymmetry is inherent to the nature of the transformation — not all changes are equal, but no leap is disproportionately larger than the rest.
Leaps 1→2 through 3→4 build the foundations of the online enterprise. Leaps 4→5 through 9→10 build the real-time enterprise. The Quantum Leap (4→5) is the frontier between the two trajectories.
The 5 Levels · Simplified View
For executive communication and high-level diagnosis, the 10 stages are grouped into 5 levels that represent qualitatively distinct states of organizational intelligence. Levels I–II correspond to the foundations (online enterprise); levels III–V correspond to the real-time enterprise. The complete composition — stages, levels, and mapping to the Value Pyramid — is that of the IRIS map presented in “Structure of the Model.”
Assessment Dimensions by Level
| Dimension | I. Foundational | II. Structured | III. Dynamic | IV. Active | V. Intelligent |
|---|---|---|---|---|---|
| Data & Architecture | Isolated systems, no integration | Central data warehouse, ETL, dimensional model | Open semantic layer, natural-language access | Real-time data flows, operational integration | Self-managing knowledge fabric, autonomous evolution |
| Analytical Capabilities | Manual ad-hoc reports | Static BI: predefined dashboards and reports | On-demand analytics, contextual and adaptive | Proactive information, governed autonomous action | Continuous cross-domain intelligence, systemic optimization |
| People & Culture | “Data belongs to IT” | Dashboard consumers, BI team as intermediary | Empowered users, data team as curators | Rule designers and agent governors | Strategic supervisors of the ecosystem |
| Governance | No formal governance | Access control, role-based permissions | Governance of quality and semantic definitions | Autonomy governance: what an agent may do | Multi-level governance: operational, tactical, strategic |
| Operating Model | No data function | BI competency center | Data platform as a service | Agent factories, management of autonomous flows | Orchestration of intelligence ecosystems |
| Business Value | Data as a byproduct | Insights for deciding (retroactive) | Real-time knowledge, informed decisions | Autonomous actions with supervision, operational efficiency | Self-optimizing business, systemic competitive advantage |
How to use this model?
For diagnosis: Identify the stage (1–10) that best describes the organization’s current state along each dimension. An organization can be at different stages depending on the dimension — for example, at Stage 5 in Data & Architecture but at Stage 2 in Governance. The overall stage is determined by the lowest dimension, since it represents the real bottleneck.
For planning: The model allows you to chart advancement routes stage by stage. Organizations should resist the temptation to skip stages — evolutionary coexistence means that each stage builds on the foundations of the previous one. Attempting to reach Stage 7 without having resolved Stage 4 (semantic layer) will result in agents that produce unreliable results.
For executive communication: Use the 5 levels for strategic conversations (“we are at the Structured level, advancing toward Dynamic”). Use the 10 stages for tactical diagnosis and progress tracking (“we are at Stage 4; the next step is democratizing access”).
For understanding the trajectory: Stages 1–4 build the foundations — the infrastructure of data, governance, and business semantics. Stages 5–10 build the real-time enterprise — from democratic access to orchestrated autonomous reaction. Identifying which side of the Quantum Leap the organization is on is the first strategic diagnosis: are they building the foundations, or are they already transforming the way they operate with their information?
Quick Reference: The 10 Stages
Quick-lookup table; the detail of each stage lives in its section.
| # | Name | In one sentence | Information flow |
|---|---|---|---|
| 1 | Fragmented | Scattered data with no connection | Each system has its data; nobody sees the whole |
| 2 | Systematized | Orderly capture in defined systems | Data is registered consistently but exploited manually |
| 3 | Centralized | Central repository with classic BI | Consolidated data → predefined dashboards → users consume |
| 4 | Modeled | Semantic layer and governed definitions | Data modeled with business meaning; analysis within the pre-built universe |
| 5 | Accessible | Free access on demand · start of the real-time enterprise | Anyone asks, the system answers — no intermediaries |
| 6 | Contextual | Contextual, adaptive information | Information adapts to context; crosses sources; enriches answers |
| 7 | Proactive | Information seeks out the user | Continuous monitoring → detection → contextualized alert → human decides |
| 8 | Bidirectional | Governed autonomous action | Agents execute actions within rules; humans supervise results |
| 9 | Coordinated | Cross-domain coordination | Agents from different domains communicate and optimize with each other |
| 10 | Orchestrated | Self-managing ecosystem · real-time enterprise in full | The system evolves autonomously; strategic human supervision |
Cross-Reference
IRIS is the measurement instrument of the KNOWING axis — organizational intelligence. Together with MOTOR (the Organizational Automation Maturity Model), it forms the complete diagnostic pair of organizational transformation in the era of agentive AI. IRIS measures how information flows; MOTOR measures who executes the work.
The Introduction of this book provides the conceptual framework that both models operationalize. The fundamental concepts — the Value Pyramid, the Quantum Leap, the Three Axes of Change, the Continuous-Intelligence Cycle, and the distinction between online enterprise and real-time enterprise — are the shared foundation.